Connect a REST agent
Create an agent in the control plane, hand it a config, and watch its measurements and alarms flow live over GraphQL — the REST agent is the simplest one to try first.
Switch to Khorde Cloud to see the same agent pointed at the hosted platform instead.
This picks up where the quickstart left off — a Hub running locally at localhost:8085. If you haven't done that yet, start with Run the Hub locally.
Open the control plane at localhost:8085/ui and log in with the admin account from the quickstart. Agents are provisioned from there, not from the agent's own config — the Hub creates its identity and hands it a key. In the control plane, Agents → New agent.
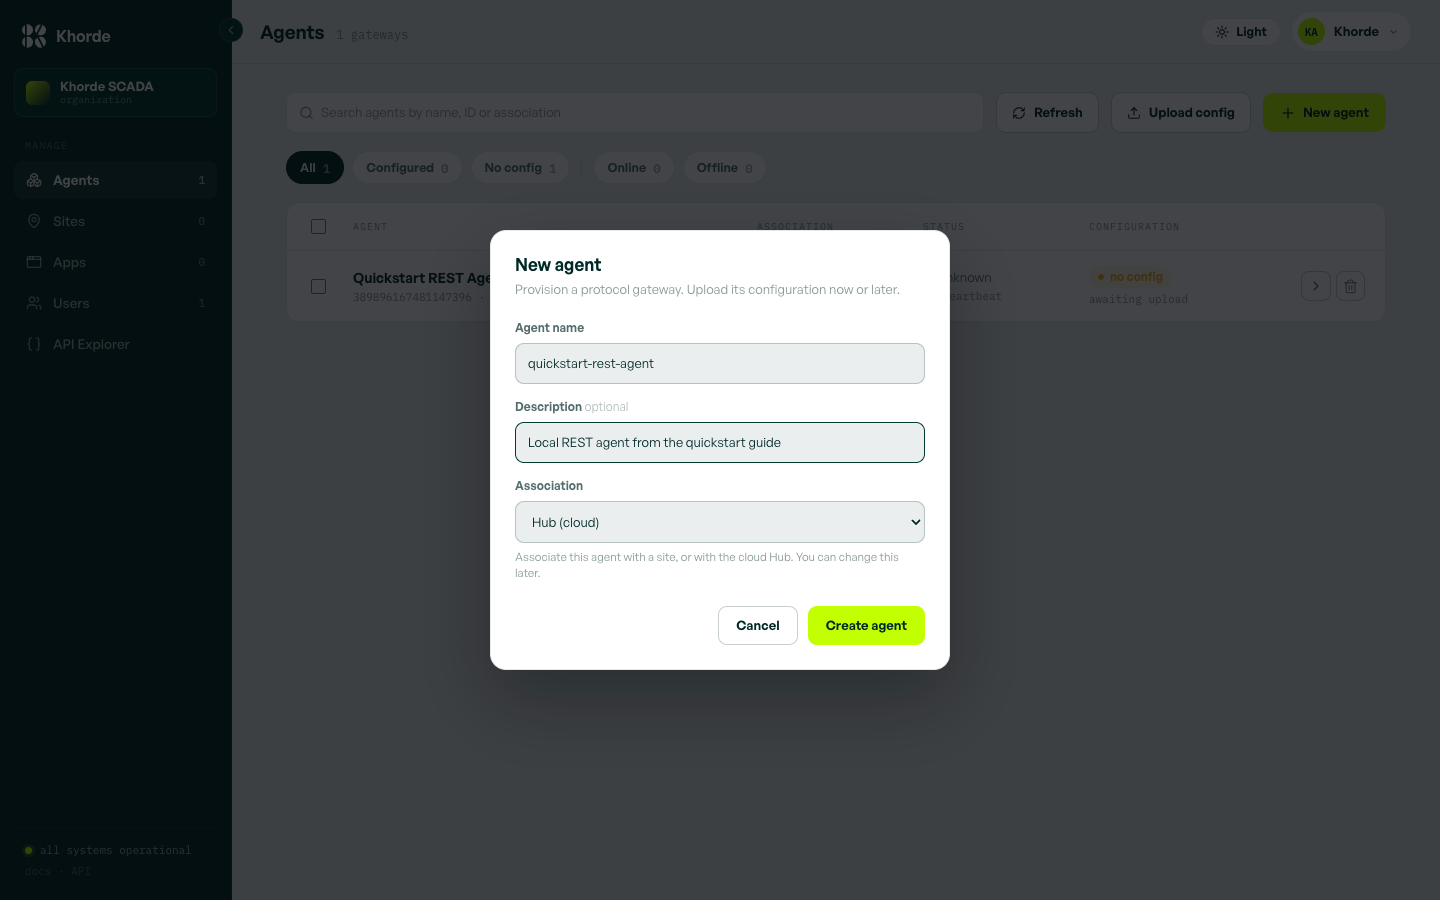
Open the agent and click Generate key. It downloads once as a JSON file containing a private key — save it, it can't be shown again.
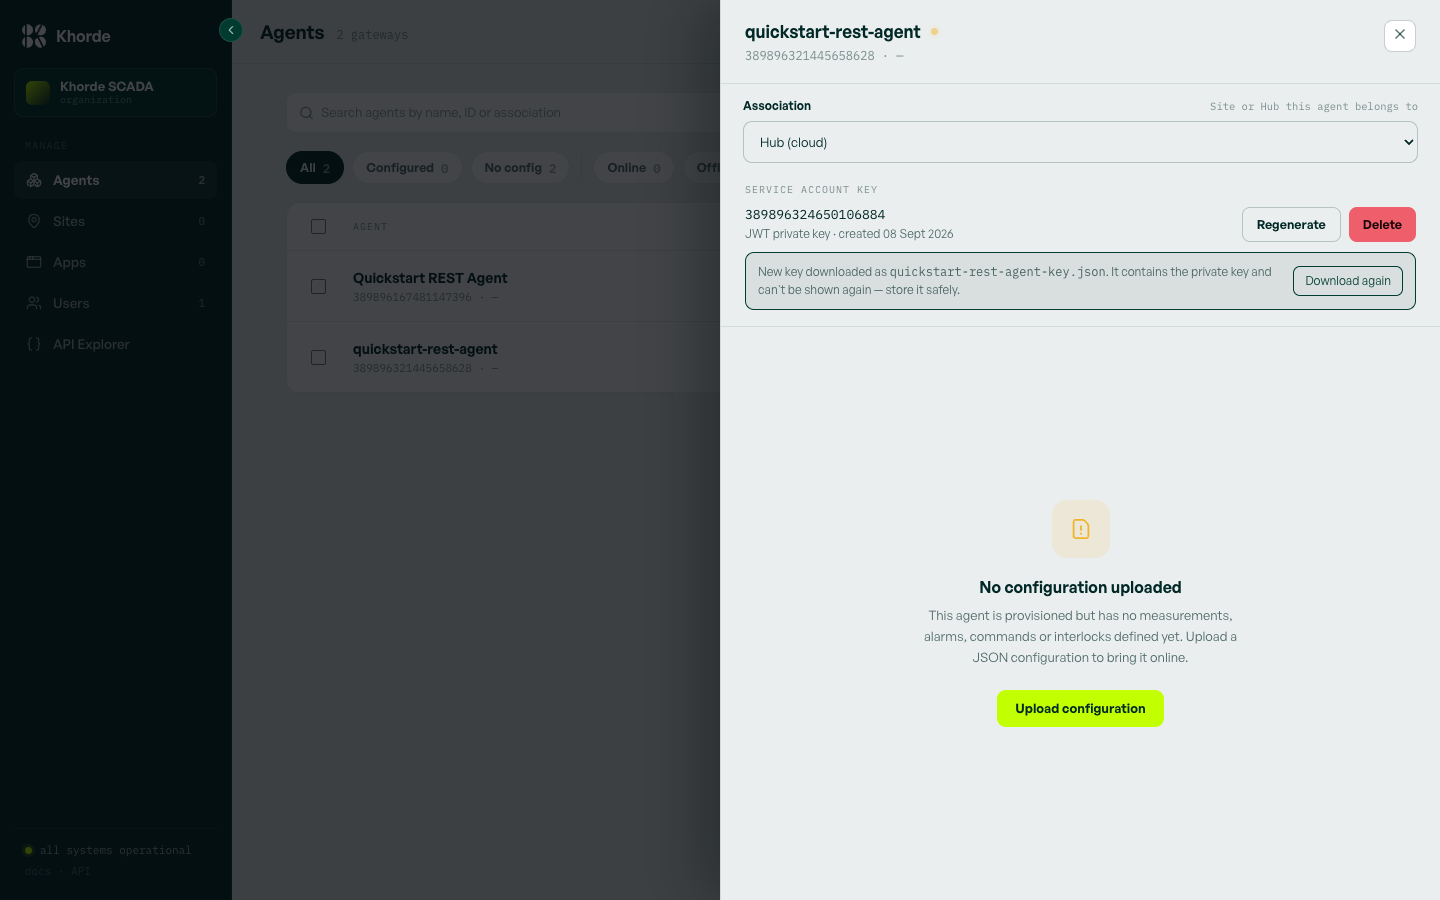
Save the two files below next to the downloaded key, renamed to service-user.json.
services:
  rest-agent:
    image: khorde/rest-agent:latest
    ports:
      - "9090:9090"
    volumes:
      - ./config.yaml:/opt/agent/config.yaml
      - ./service-user.json:/opt/agent/service-user.json
    extra_hosts:
      # So the agent can reach the Hub's NATS broker and the IdP on your host.
      - "host.docker.internal:host-gateway"
- "auth.localhost:host-gateway"rest:
host: 0.0.0.0
port: 9090
agent:
broker:
ip: host.docker.internal
port: "4222"
tls: false
credentials:
url: http://auth.localhost:9310
service_account_path: service-user.json
command_timeout: 10sdocker compose up -d
Back in the control plane, the agent flips to Online once it connects — that's its live heartbeat, independent of the no config badge next to it. That badge tracks whether you've uploaded the JSON defining this agent's measurements and commands, a separate step from connecting.
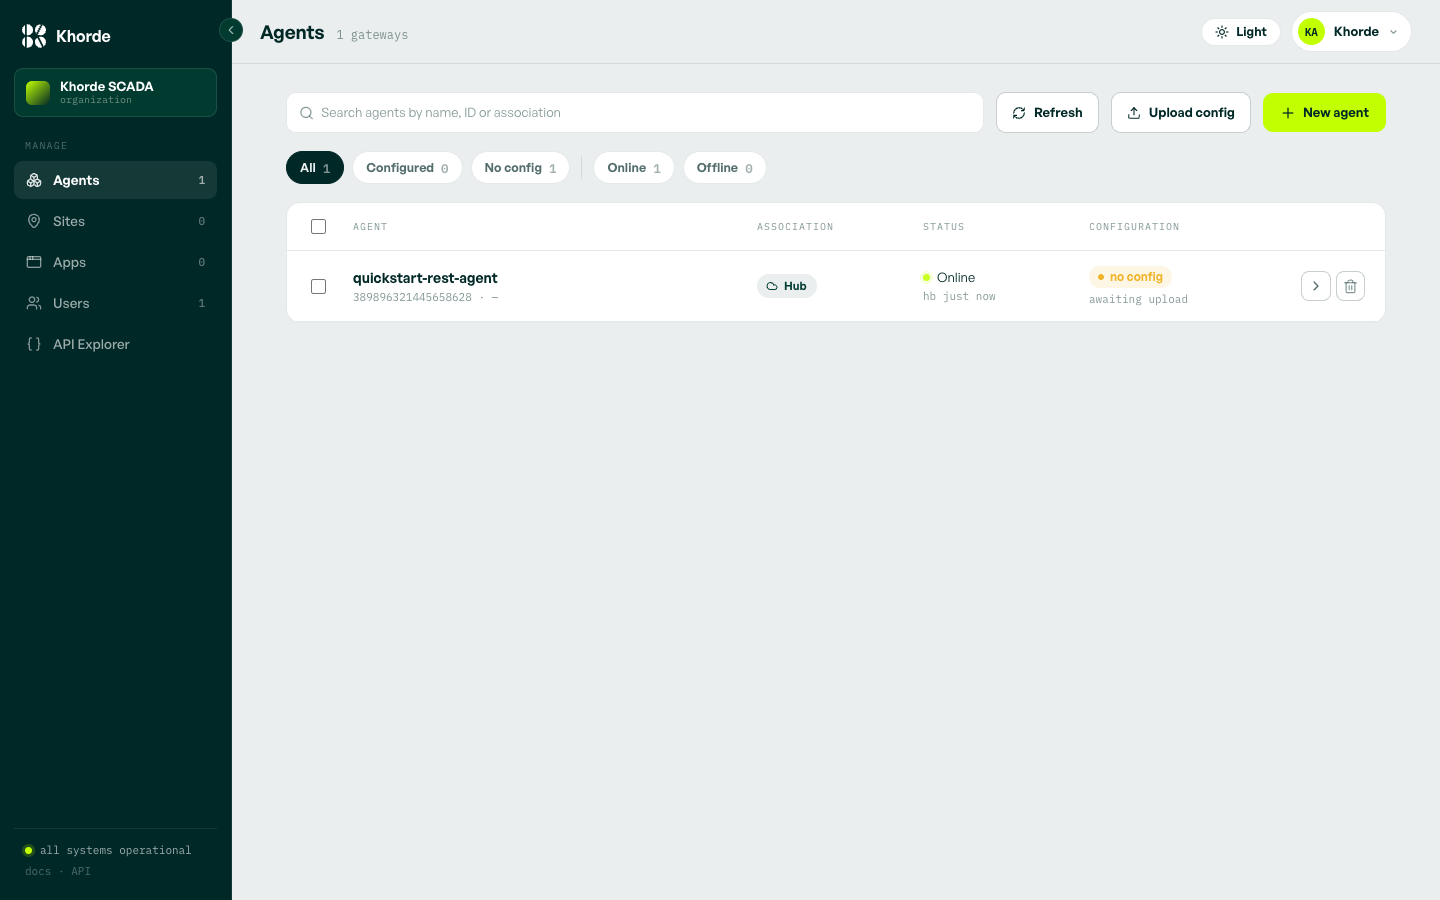
Connecting gets the agent talking; a config tells it what to say. On the agent, Upload configuration takes a JSON or YAML file — one file can cover several agents, each keyed by its name. Four sections, regardless of protocol:
- measurements — the points read off the equipment: a name, what equipment it belongs to, discrete or analogical, and whether to keep its history.
- alarms — conditions evaluated off a measurement's value, referencing it as
equipment::name. - commands — the writable operations sent back to the equipment, each tied to a piece of equipment and optionally guarded by an interlock.
- interlocks — reusable conditions a command can require before it's allowed to run.
Each entry also carries a driver block addressing that point on the wire — that shape is specific to the protocol, covered in full on the REST agent reference page. A minimal example, one of each section — for the rest of the field reference, value conversion, and interlock operators, see Agent configuration:
{
  "quickstart-rest-agent": {
    "type": "client",
    "protocol": "rest",
    "measurements": [
      {
        "name": "status",
        "equipment": "breaker-1",
        "type": "discrete",
        "store": true,
        "tags": ["demo"],
        "driver": { "type": "discrete", "path": "1" }
      }
    ],
    "alarms": [
      {
        "name": "breaker-1-trip",
        "area": "breaker-1",
        "type": "digital",
        "set": 1,
        "reset": 0,
        "severity": "high",
        "meas": "breaker-1::status"
      }
    ],
    "commands": [
      {
        "name": "open",
        "equipment": "breaker-1",
        "driver": { "type": "discrete", "value": 1, "path": "1" },
        "interlock": { "key": "breaker-1-safe" }
      }
    ],
    "interlocks": [
      {
        "key": "breaker-1-safe",
        "description": "Only allow open while status reads closed",
        "expression": { "eq": ["breaker-1::status", 0] }
      }
    ]
  }
}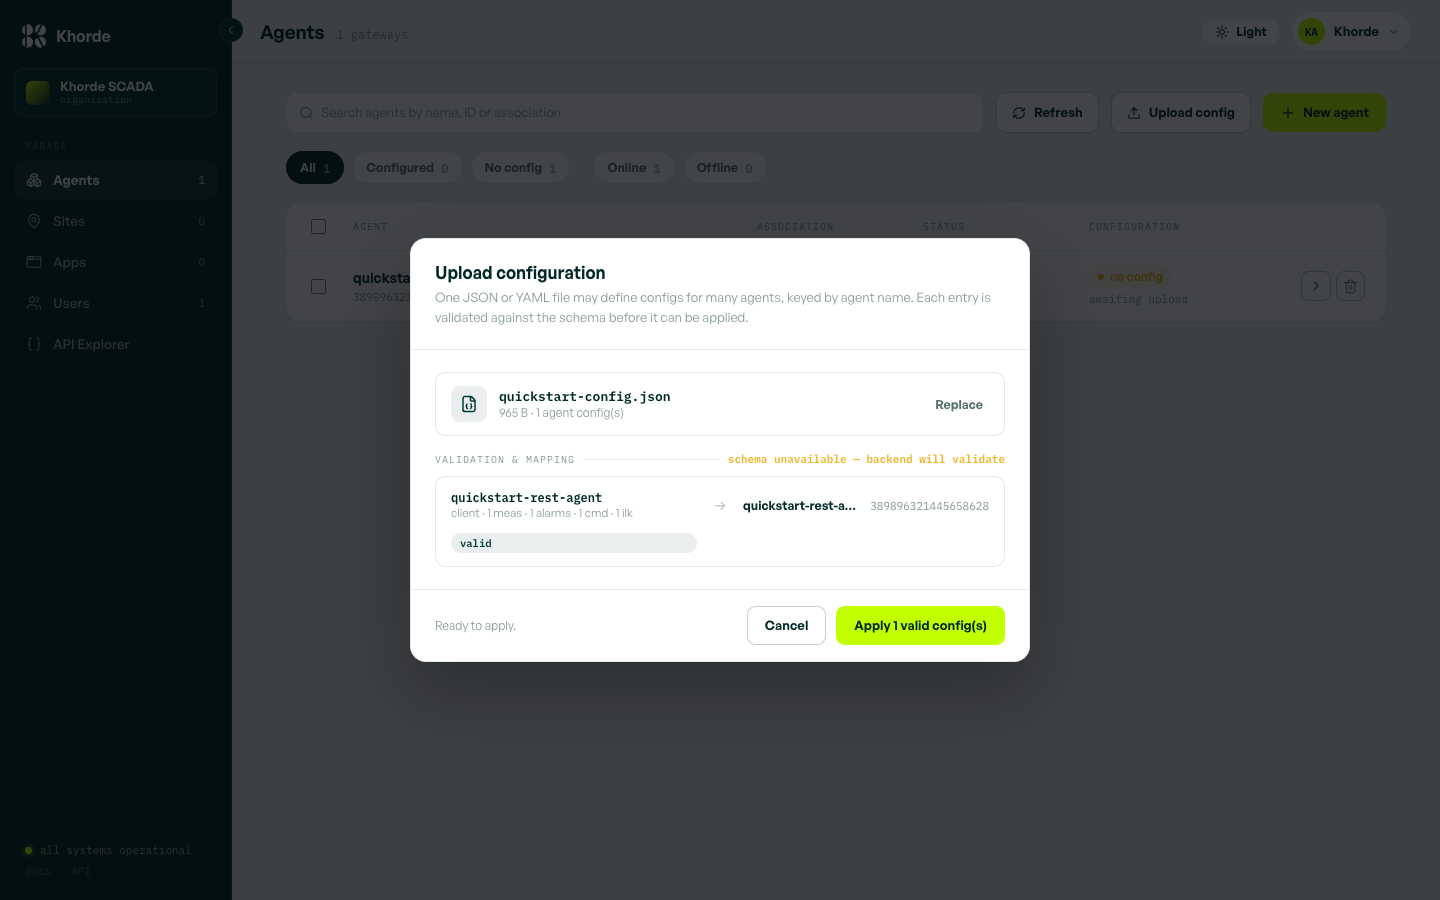
Once applied, the no config badge becomes configured.
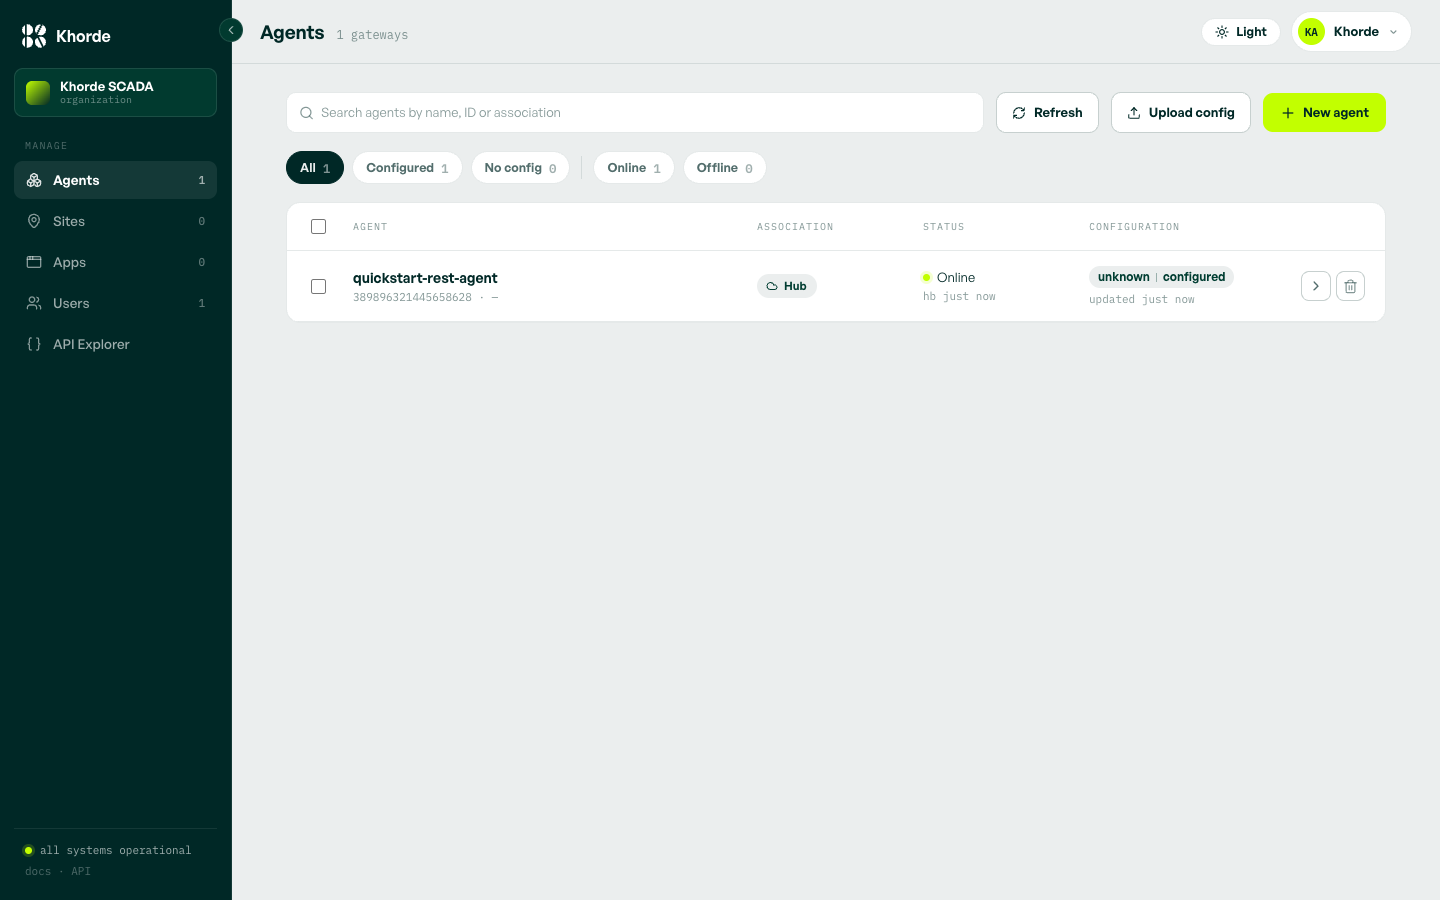
Click the agent again — same panel as the key — and it now also shows what got applied: Grouped by equipment, with tabs for measurements, alarms, commands, and interlocks.
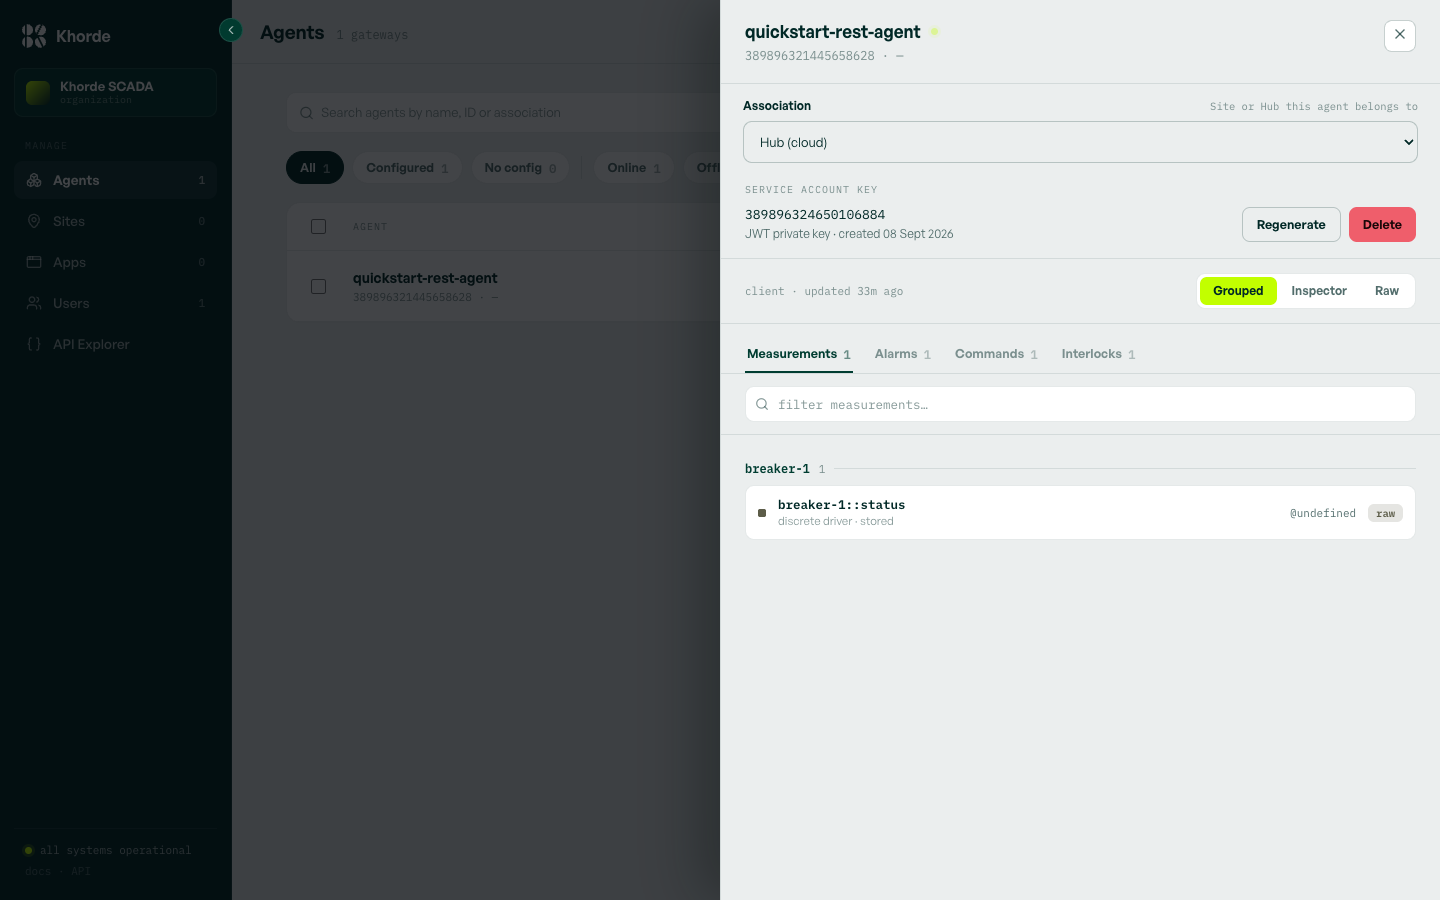
Raw switches to the exact JSON or YAML stored for it — the file you uploaded, normalized, with a copy button.
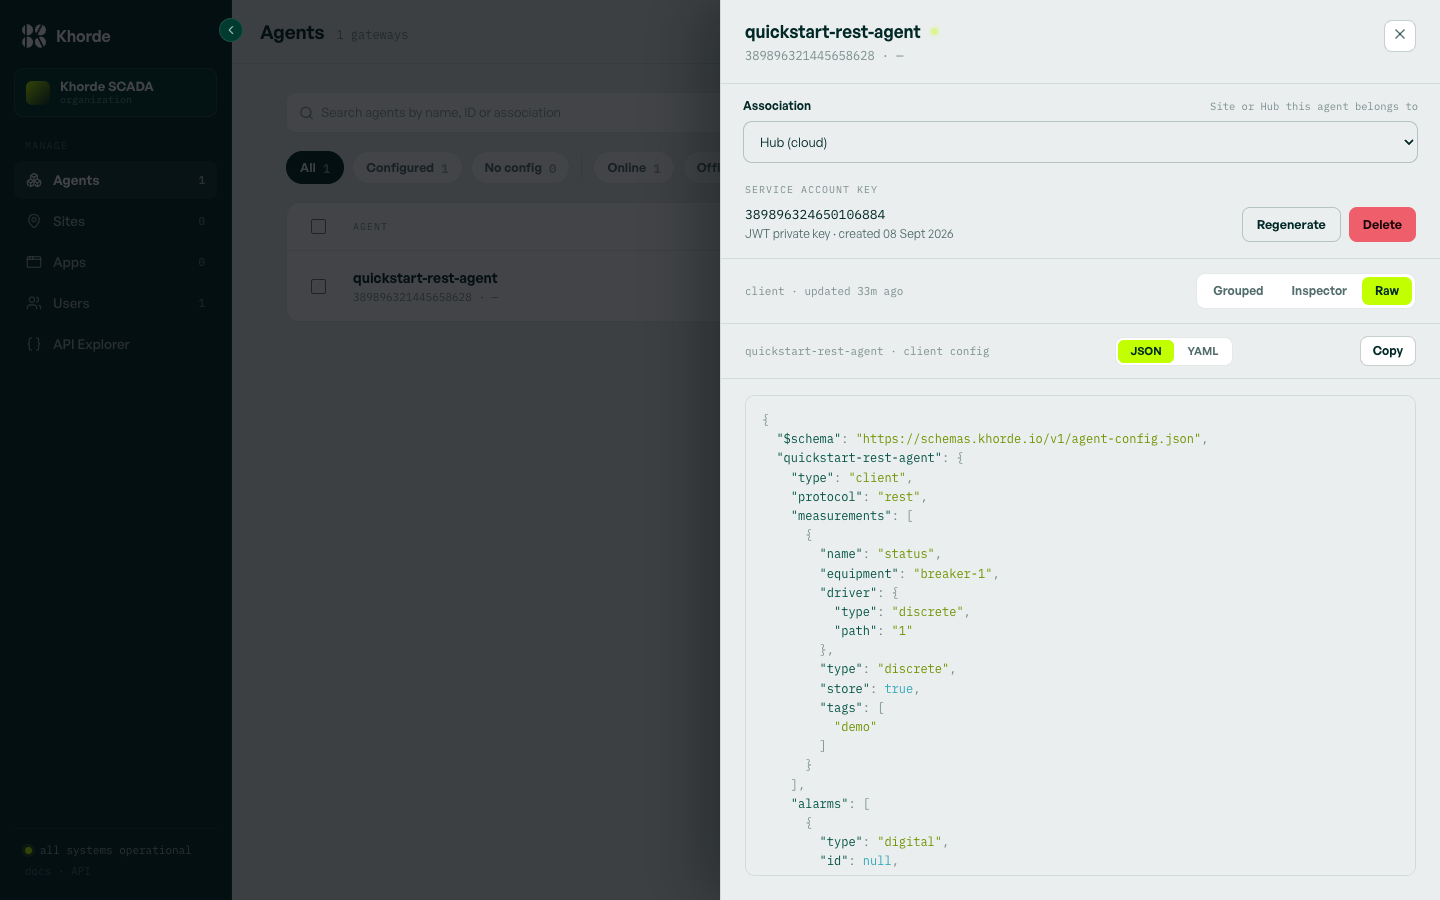
The status badge polls; this doesn't. API Explorer is a GraphiQL playground on the same authenticated session — run this subscription and watch lastSeenAt tick forward as heartbeats arrive over the open connection, no refresh needed.
subscription {
  agentHeartbeatSubscribe(agents: ["quickstart-rest-agent"]) {
    agent
    lastSeenAt
    status
  }
}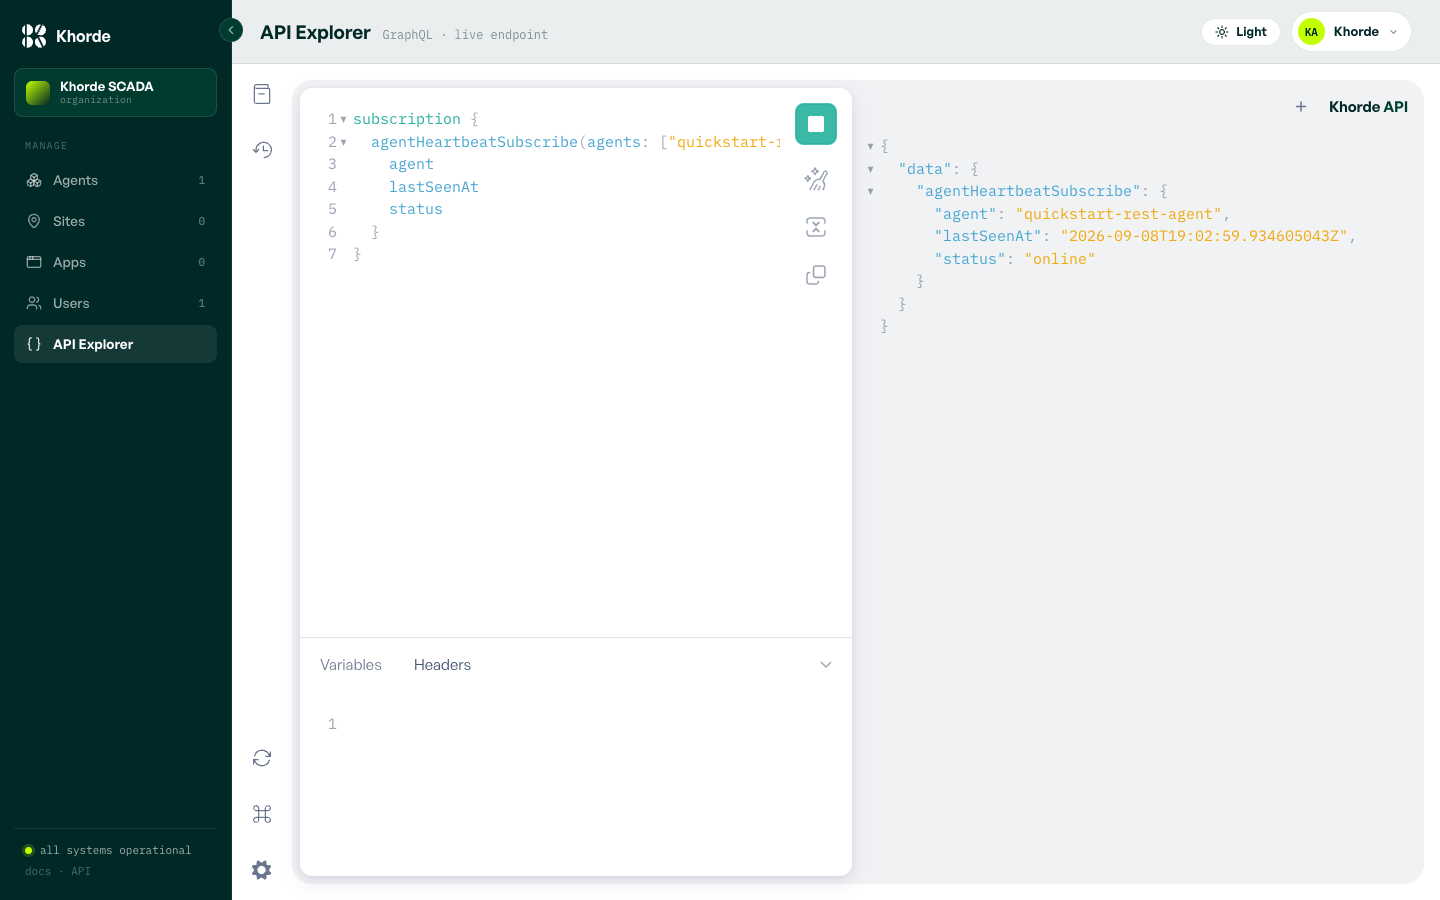
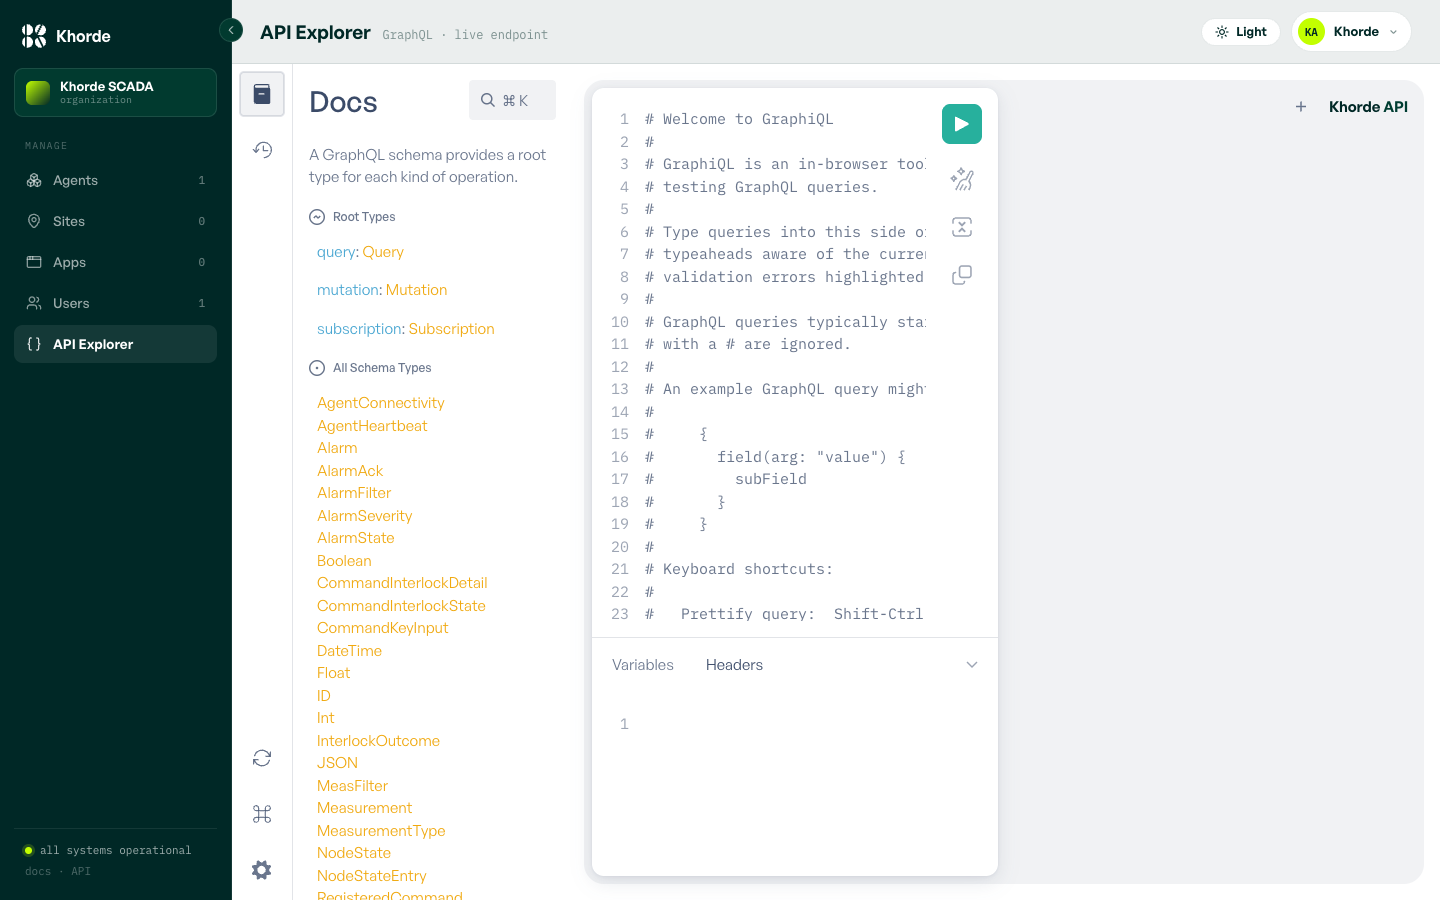
That heartbeat subscription is one field. The book icon in API Explorer's left rail opens Docs — every query, mutation, and subscription the Hub exposes, searchable with ⌘K.
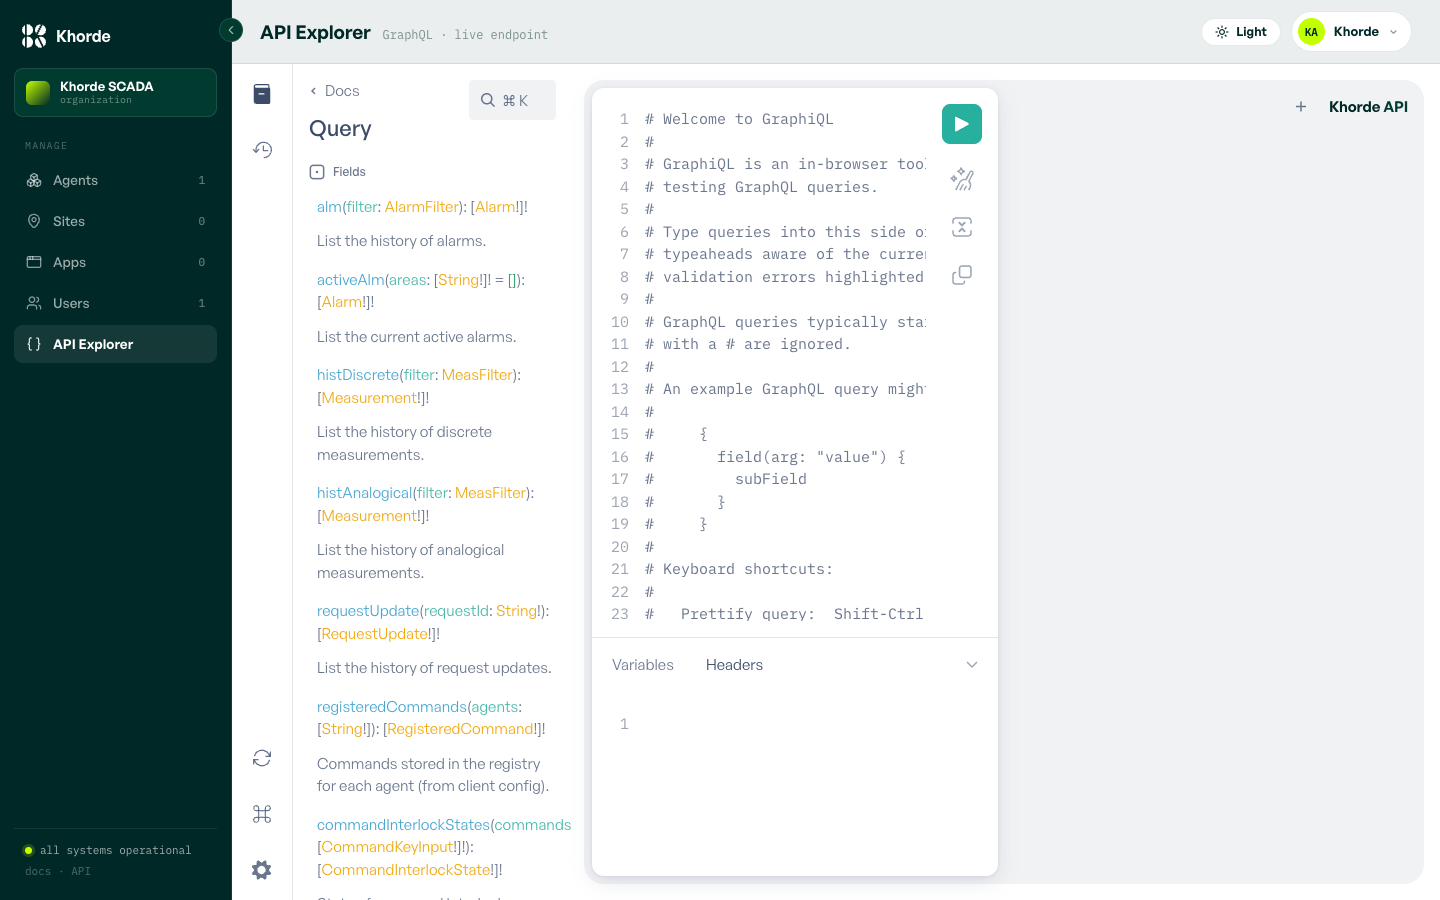
Click into any root type for its fields, arguments, return types, and descriptions — Query below has the rest of agentHeartbeats's siblings: alarms, measurement history, registered commands, interlock state.
The REST agent isn't polling a real field device — it's waiting for you to be one. POST /addr/{path} on its own port, where {path} is the driver path from the config — 1 for our status measurement:
curl -X POST http://localhost:9090/addr/1 \
  -H "Content-Type: application/json" \
  -d '{"value": 0}'
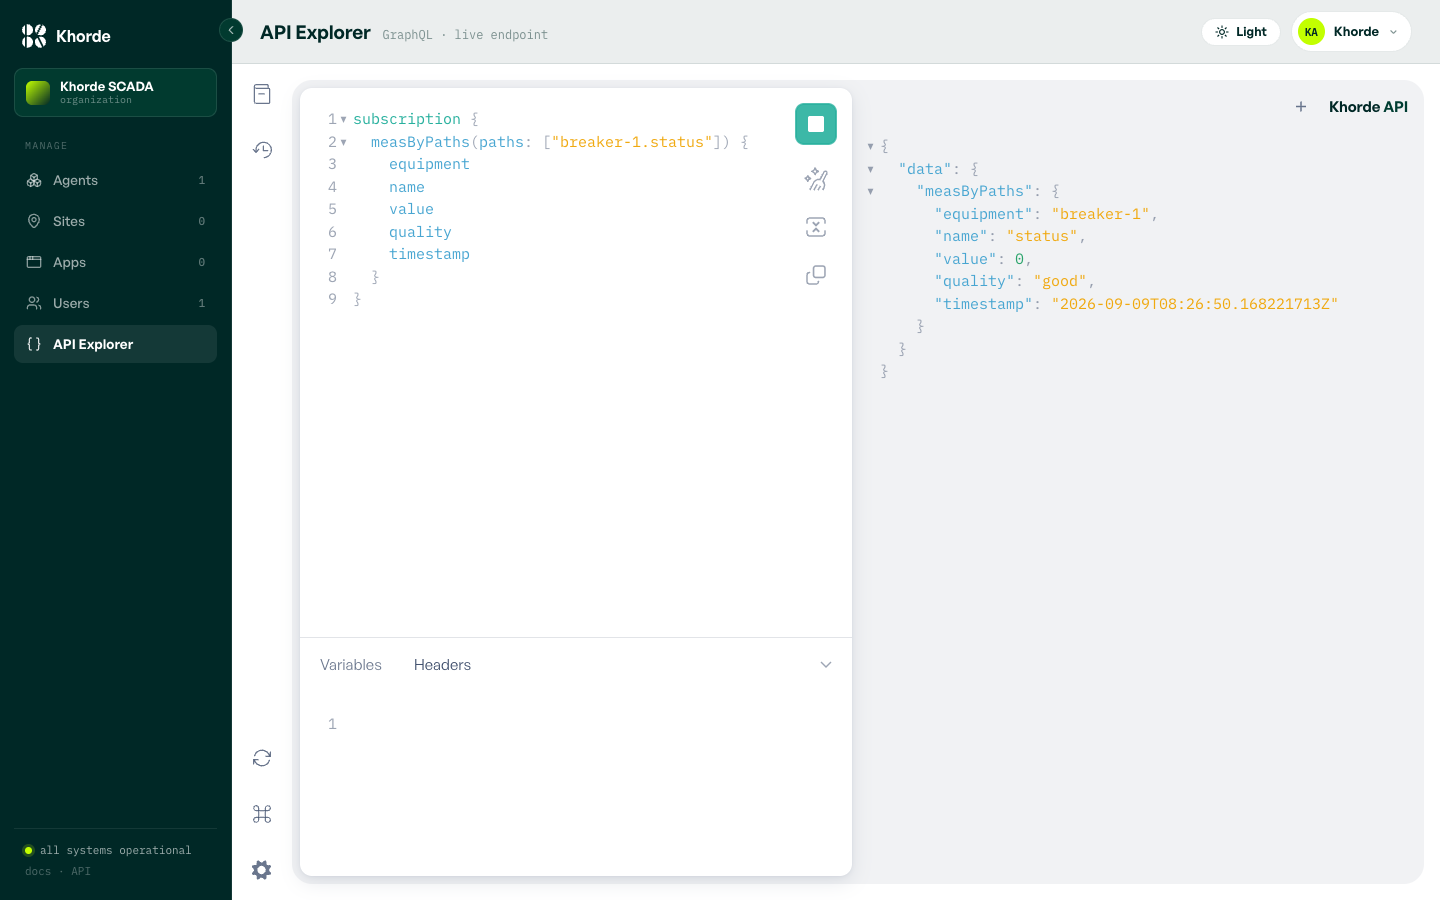
Same subscription pattern as the heartbeat, this time on the measurement itself — equipment.name:
subscription {
  measByPaths(paths: ["breaker-1.status"]) {
    equipment
    name
    value
    quality
    timestamp
  }
}
POST that same address again with a new value, and it updates without a refresh:
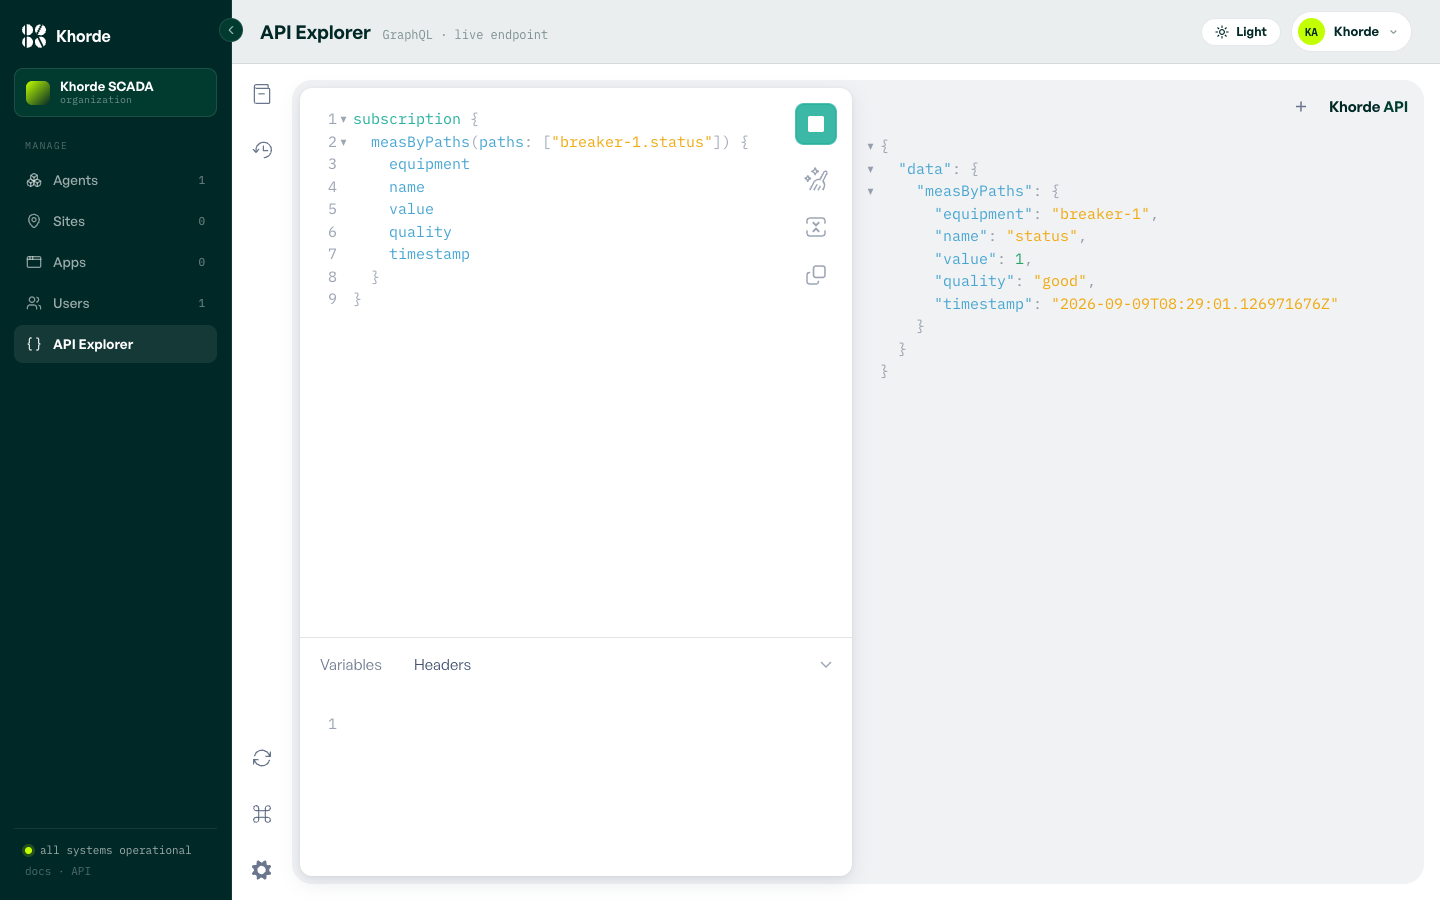
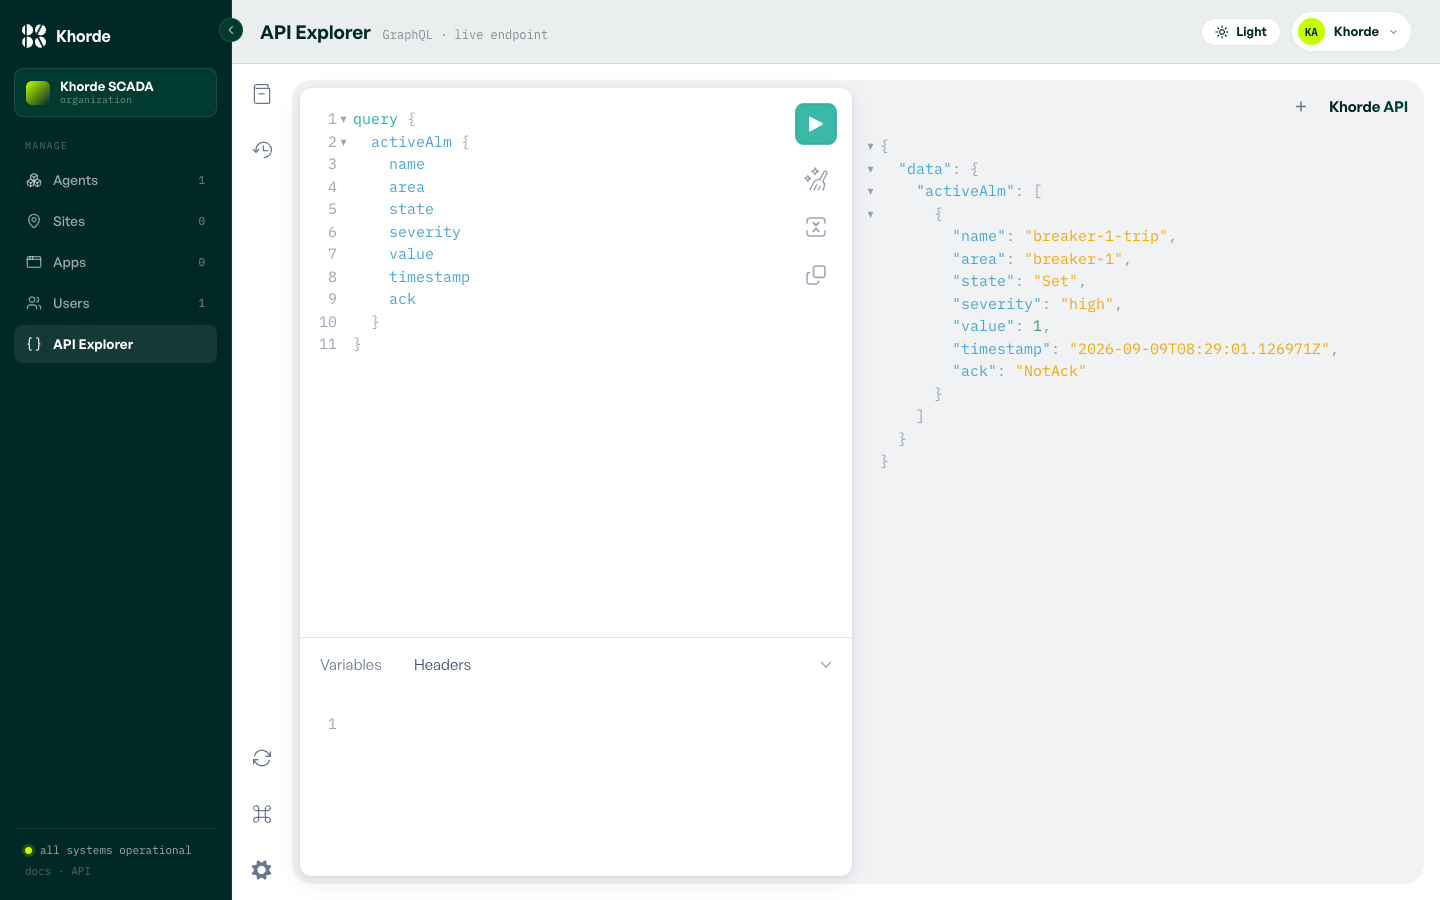
That last value — 1 — is this measurement's alarm set value from the config above. activeAlm lists what's currently active:
curl -X POST http://localhost:9090/addr/1 \
  -H "Content-Type: application/json" \
-d '{"value": 1}'query {
activeAlm {
name
area
state
severity
value
timestamp
ack
}
}
Agent configuration
The full schema for measurements, alarms, commands, and interlocks. Agent configuration.
Build your own HMI
Register a standalone app and call this same API from your own login screen and dashboard. Build your own HMI.
Other protocol agents
The same create-agent-then-connect flow above works for IEC 60870-5-104 and IEC 61850 agents too — only the agent image and its own config differ.
Explore the GraphQL API
Everything an HMI needs — measurements, alarms, commands — is served over GraphQL on the same :8085. Schema reference is on the Docs page.